
Macro Monthly: August Edition
Hi people, it’s René Steiner from SteinerCapital. Below you will find my latest research and views on markets. Note that this is NEVER financial advise.

Key Takeaways
Inflation Expectations: The US and Canada are clear outliers here; the rest of the coverage points to higher core inflation. Overall, the global inflation components point to higher prices across the board, with a clear divergence emerging in core inflation.
Growth Expectations: While PMIs point to a growth trend across all economies in the coverage, cyclical GDP shows negative growth for the Eurozone, the UK, and Switzerland, while the rest of the coverage remains on an upward trajectory.
Because cyclical GDP tends to lag PMIs by roughly two to three months, my suspicion is that the broader Eurozone is sitting at an inflection point, and that we will see positive GDP growth here in the months ahead.
Introduction
This publication provides a structured, cross-jurisdictional assessment of the global macro landscape. Our focus remains on the core G8 economies most relevant for institutional asset allocation and FX overlay strategies: the US, Eurozone (proxying via Germany where necessary), Japan, UK, Switzerland, Canada, Australia, and New Zealand.
We utilize a standardized analytical framework, prioritizing leading indicators for inflation and real economic activity. These signals are benchmarked against central bank reaction functions and forward guidance to synthesize a coherent trajectory for global monetary policy.
The Objective:
Momentum Mapping: Identifying underlying macro shifts across regions before they are fully priced in.
Trade Translation: Distilling macro data into actionable FX views evaluating both directional bias and relative value (RV) opportunities.
Looking at Inflation
The drivers of the current inflationary impulse are multifaceted and frequently contested. Rather than chasing a single “root cause,” our objective is pragmatic: we assess the evolution of key macro variables and their implications for the inflationary process across developed markets (DM). We decompose these dynamics into global vs. local components, further isolating volatile headline drivers from core stickiness.
Global Components
Inflation remains (first and foremost) a global phenomenon. While idiosyncratic domestic outcomes persist, the dominant price impulses are driven by synchronized global forces, amplified or dampened by local fiscal policy and structural labor market rigidities.
Volatile Inflation Components
Our primary proxies for food and energy prices are both still pointing higher.
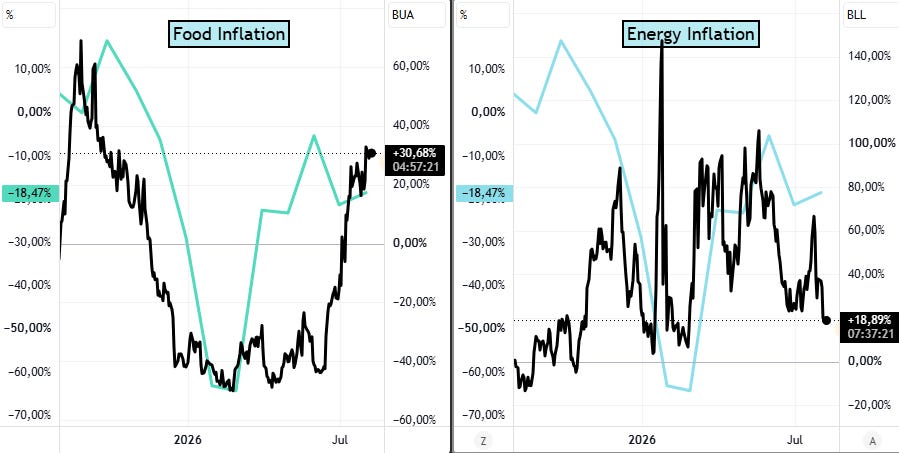
The food proxy is up 30% year on year, while the energy proxy is up 18% year on year.
Global Core Components
Looking at the components that more significantly influence core inflation, we get the same picture: higher prices.
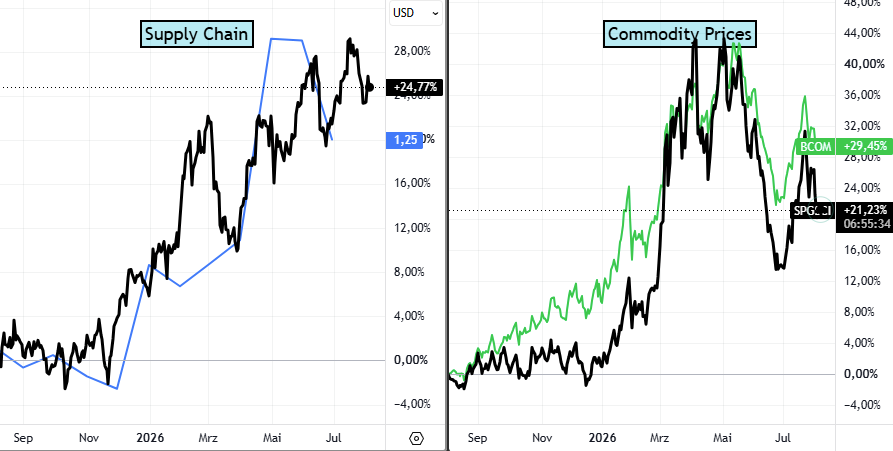
Our supply chain tracker is up 25% year on year, and our commodity baskets are up roughly 20% year on year over the same period. Overall, there are still inflationary pressures in the system, which will keep central bankers' attention for the time being.
Core CPI Forecast - G8
Moving from the global systemic inflationary components, over which individual countries have little control (with the exception of the US, where continued military involvement in the Middle East arguably remains a factor keeping inflation elevated), we turn to country-specific inflation forecasts.
Here we focus on housing prices and wage growth, except for Australia and New Zealand. For those two, the only meaningful lead we found for their core CPI measure was global supply chain pressure.
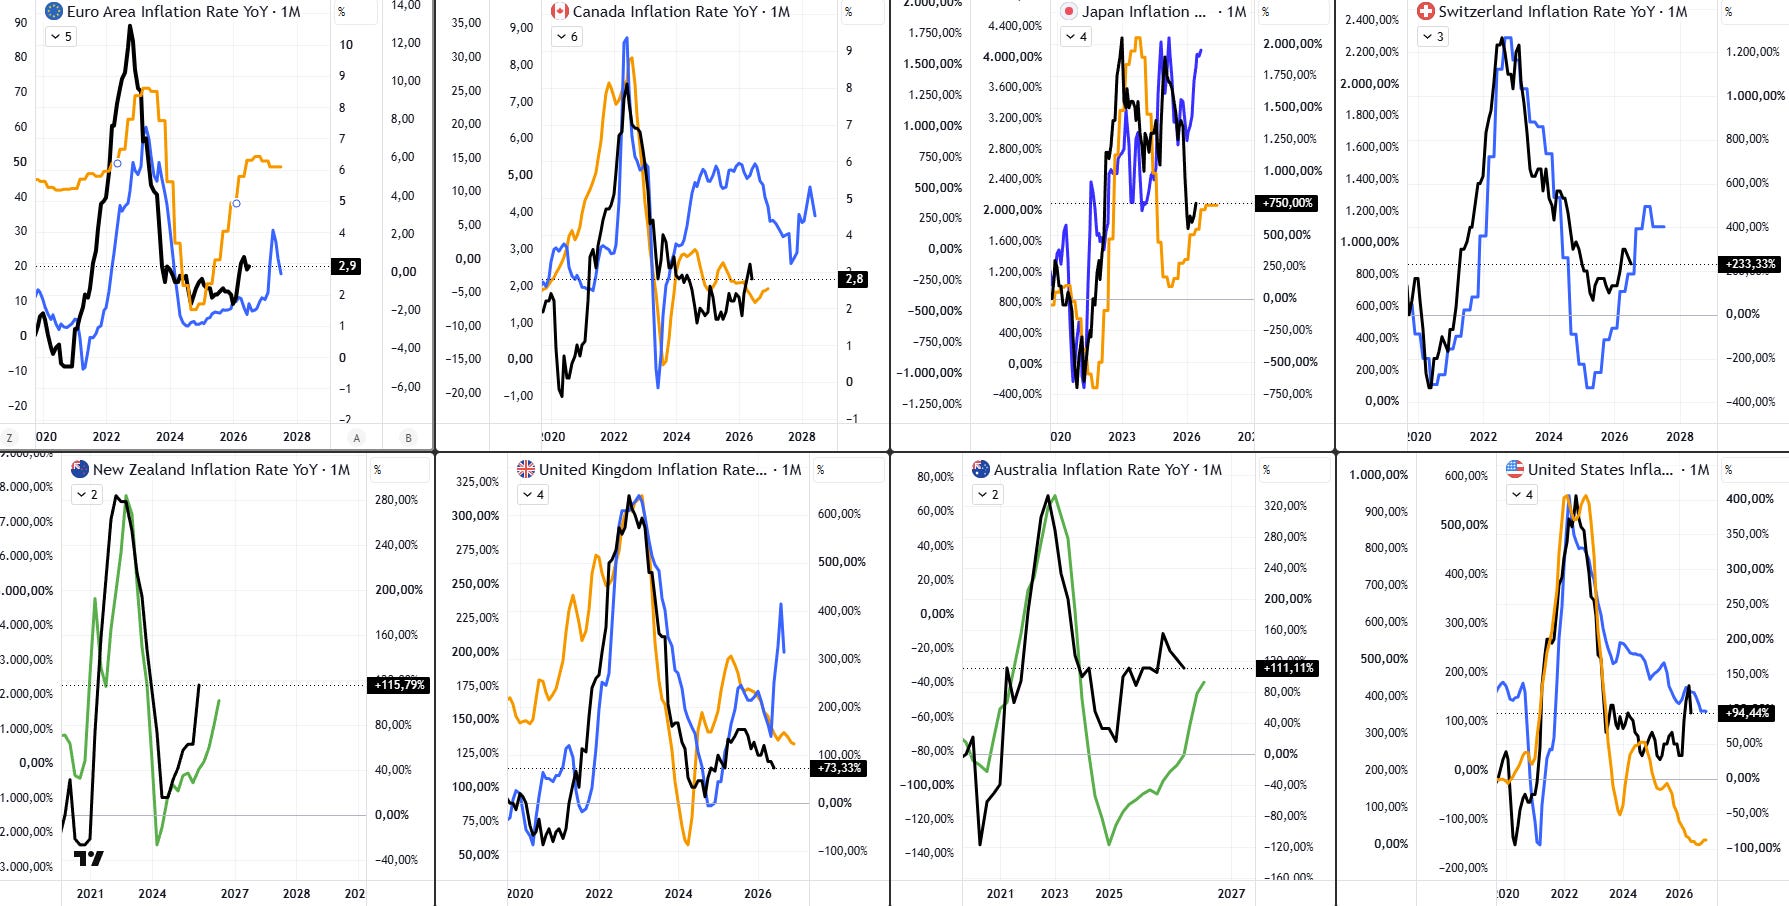
These proxies point toward higher inflation for the Euro Area, Japan, Switzerland, Australia, and New Zealand. The US and Canada, by contrast, look fine, and the UK sits somewhere in between.
Key Takeaways
Global Inflation: Every single proxy for global inflation is accelerating. There is no way around it: there is a high probability of stronger inflation in the months ahead.
Domestic Core Inflation: The US and Canada are clear outliers here; the rest of the coverage points to higher core inflation.
Looking at GDP
How GDP works for the coverage
In macro analysis, growth is never monolithic. We recognize that domestic consumption, global trade exposure, and fiscal multipliers vary significantly across our coverage. To isolate these idiosyncratic risks, we decompose GDP into its core engines: Consumption, Investment, Government Spending, and Net Exports.
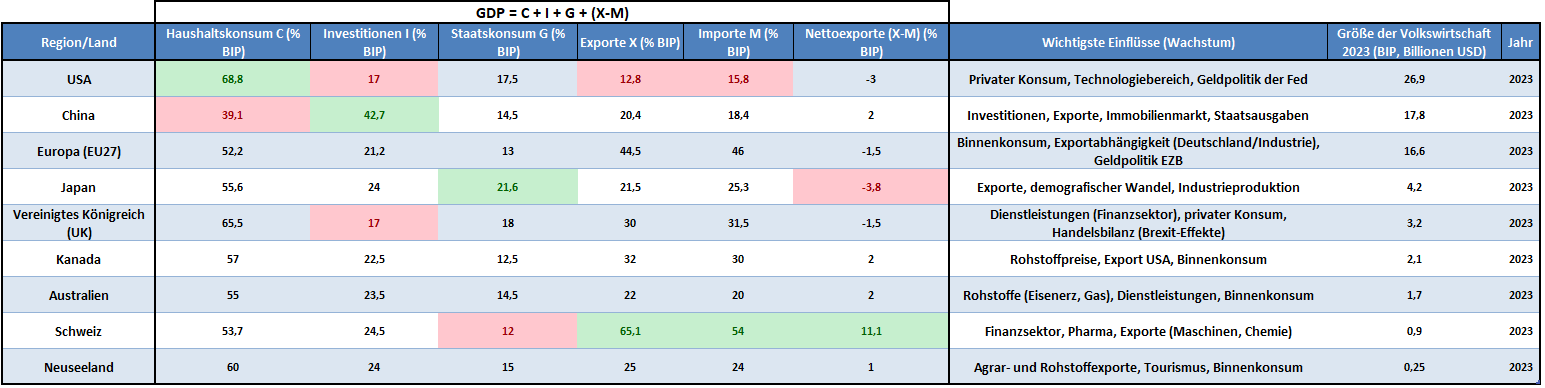
The Structural Map:
United States: The quintessential consumption-driven powerhouse. Its low relative exposure to global trade explains why the US remains the “cleanest shirt in the dirty laundry” during global tariff wars.
China: Investment remains the primary alpha driver, leaving the tape highly sensitive to Beijing’s credit impulses and infrastructure cycles.
Japan: Fiscal policy is the dominant variable. Government support plays a outsized role, making the macro outlook a function of Diet elections and geopolitical positioning.
United Kingdom: A bifurcated story of a resilient consumer sector battling structurally lethargic investment dynamics.
The “Commodity Trio” (AUD, CAD, NZD): Shared DNA. These economies are effectively a levered play on commodity cycles, housing, and external demand.
Eurozone & Switzerland: High beta to global trade. Their export-heavy models explain why they are the primary victims of any “America First” protectionist tilt.
EPB Cyclical GDP
To front-run the “lagging” nature of official GDP prints, we utilize a Cyclical Proxy (Black Line) composed of New Orders, Industrial Production, and Housing Activity.
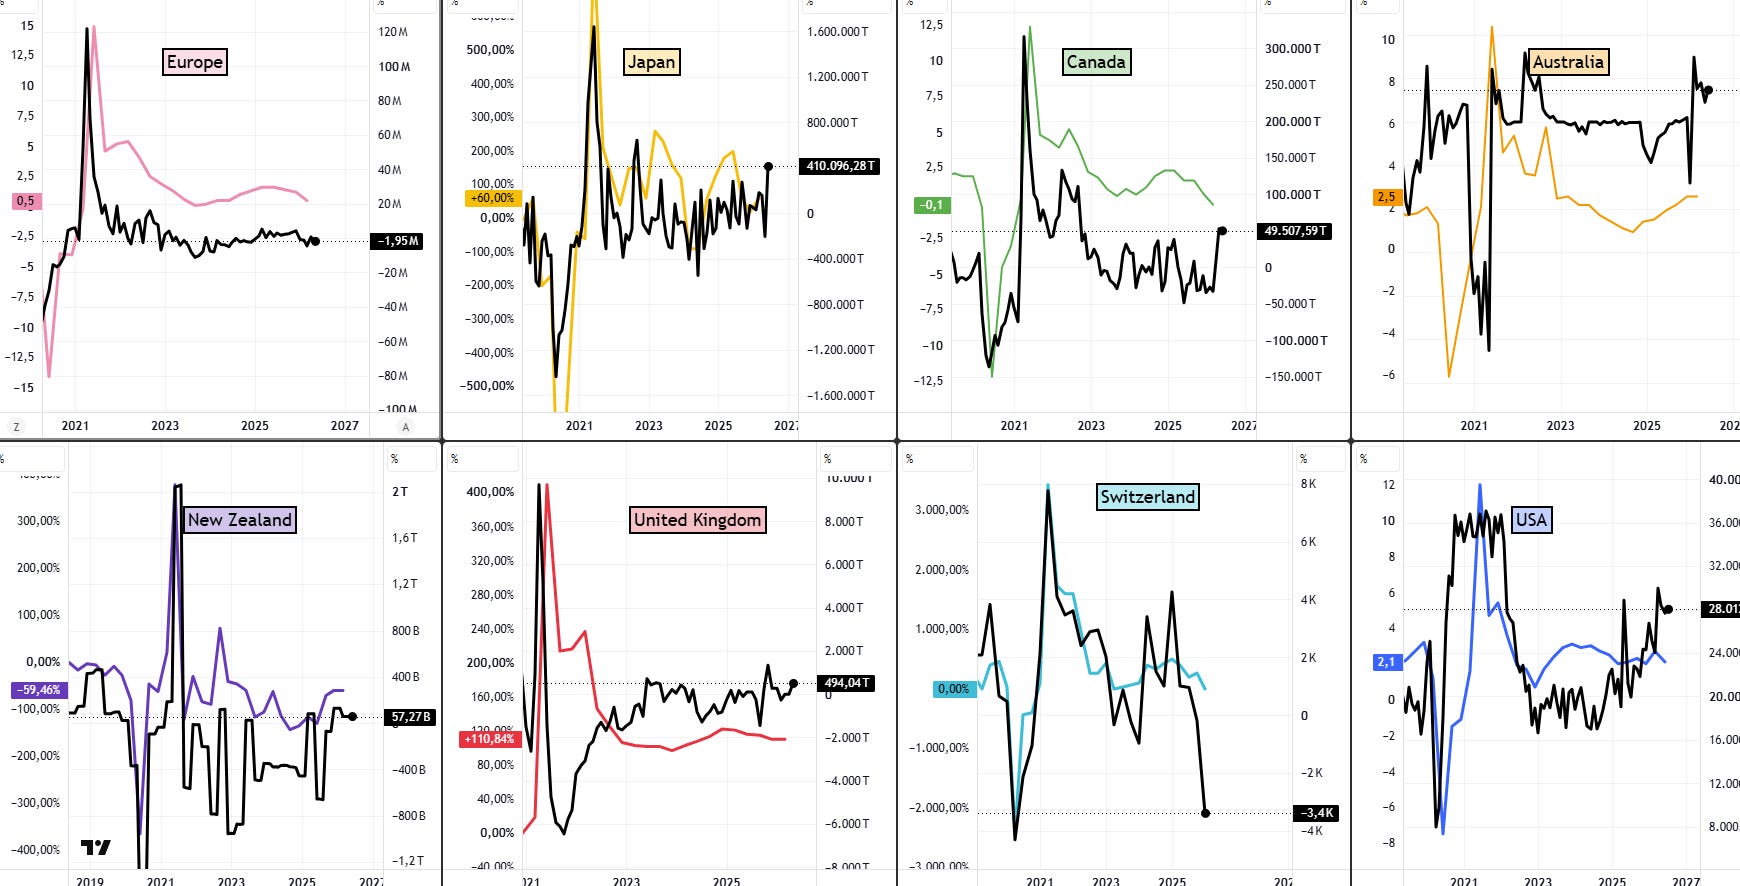
From the chart above, we can see a clear divergence between the covered economies. On one hand, we have the growth countries: Japan, Canada, Australia, New Zealand, and the US. On the other hand, we have three countries where growth is stalling or even negative: the Eurozone, the UK, and Switzerland.
The Housing Cycle
Despite housing accounting for only roughly 5% of GDP (depending on your specific accounting flavor), the ripple effects of its boom-and-bust cycles are unparalleled. Many in the field (rightfully so) argue that the housing cycle is the economic cycle.
Following the EPB Research framework, the first-order signals are New Home Sales and Building Permits.
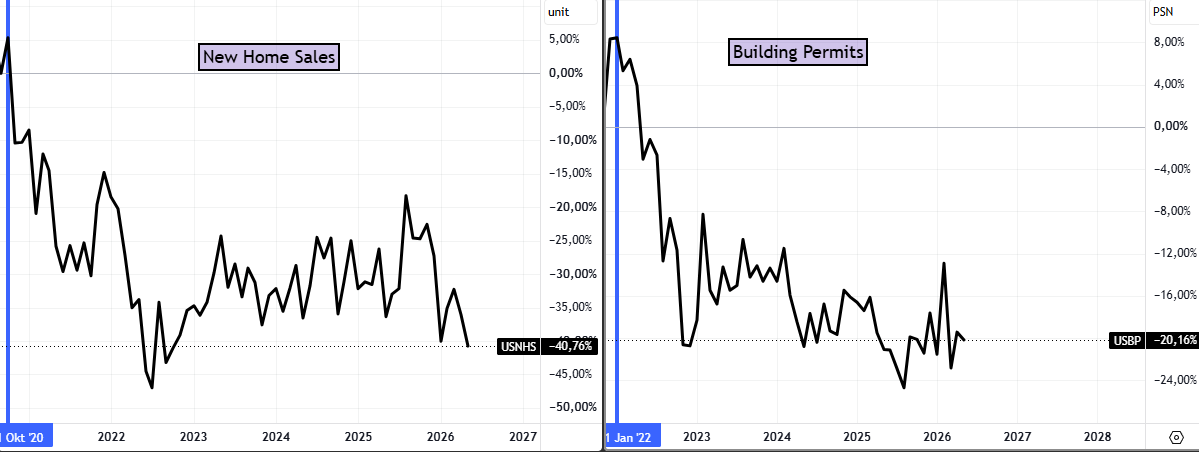
Here we can see significant weakness in the housing market since its peak (marked with the blue vertical line) in Oct 2020 for New Home Sales and Jan 2022 for Building Permits.
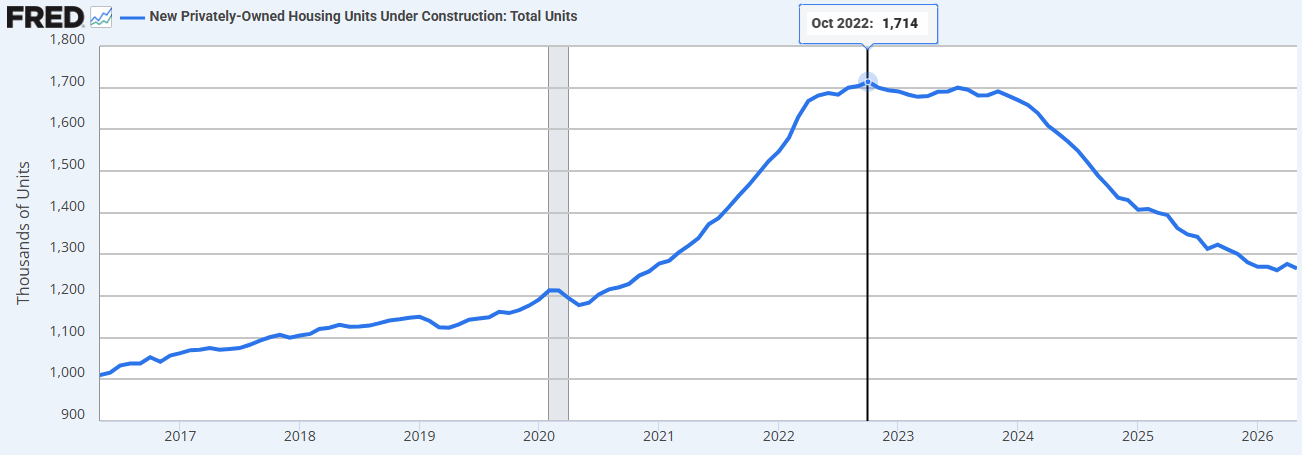
This is confirmed by units under construction, which peaked in October 2022 and has also been in a steady decline since then, now roughly 26% lower than its peak.
So the first and second order of the housing cycle have already turned. Now the question is, what does the third order say?
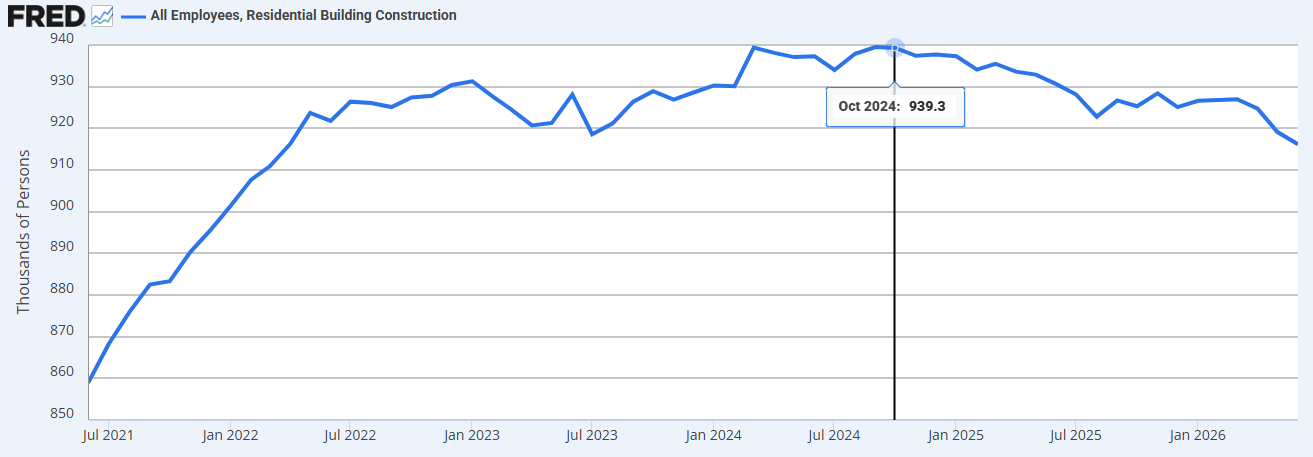
To understand that, we look at residential building employment. This makes sense intuitively: first people have to get the permit to build something new or buy a new home to begin with, then they have to construct it, which in turn means hiring construction workers for it.
The third order seems like it is about to turn, now roughly 3% lower than its peak in June 2025.
The last of the bunch is home prices. They are inelastic in nature, because the anchoring effect is so strong given their notional size for ordinary people.
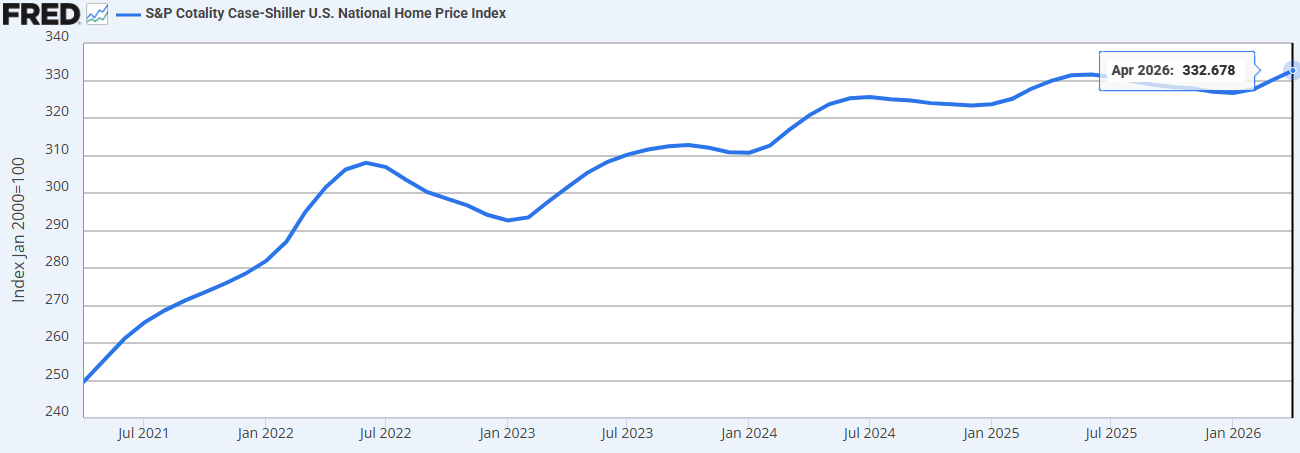
Looking at the Case-Shiller Price Index, we can see it sitting roughly at its current peak.
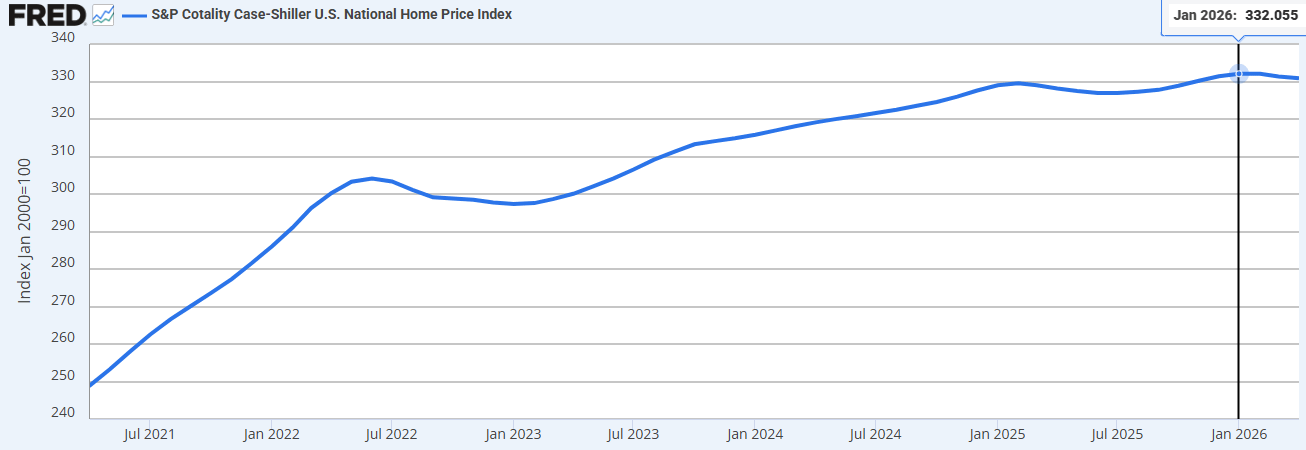
So all in all, we can clearly see that the housing cycle is turning, although it will take some time for it to really start affecting the broader economy.
Why should you care?
Because the Case-Shiller Price Index is interchangeable with real GDP YoY.
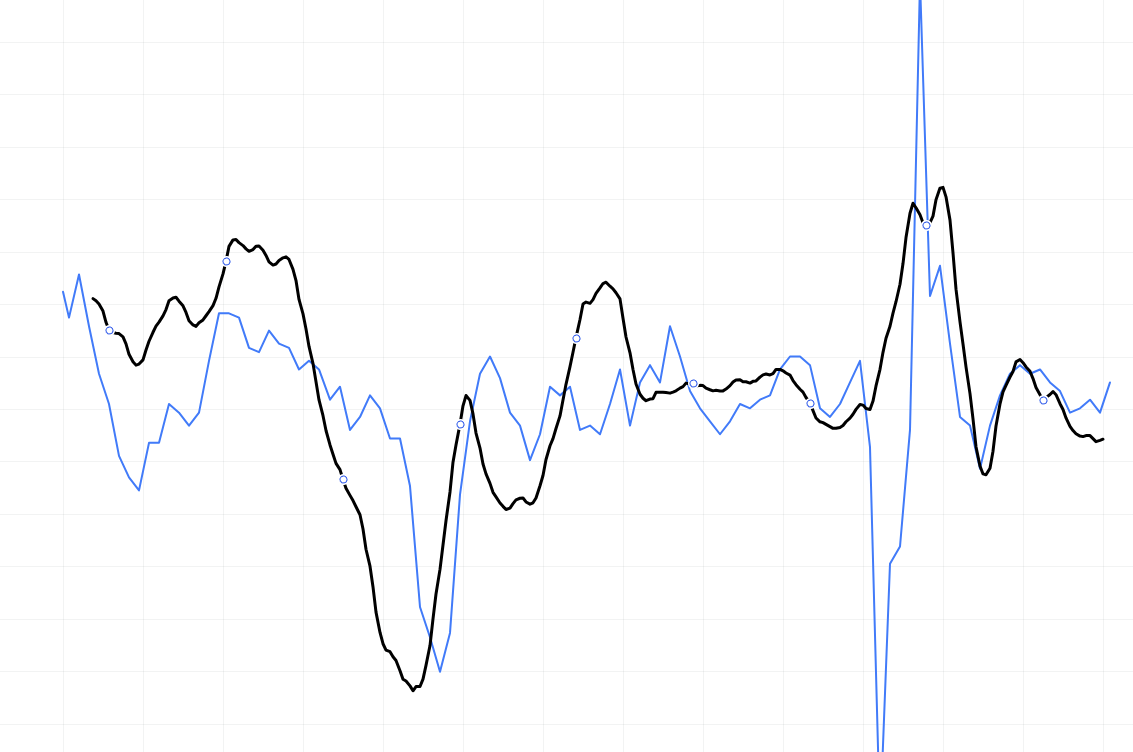
Therefore, knowing where housing prices are going is to know where GDP goes.
Purchasing Manager Indices
PMIs remain the gold standard for macro investors. The latest S&P Global Manufacturing data confirms several key themes:
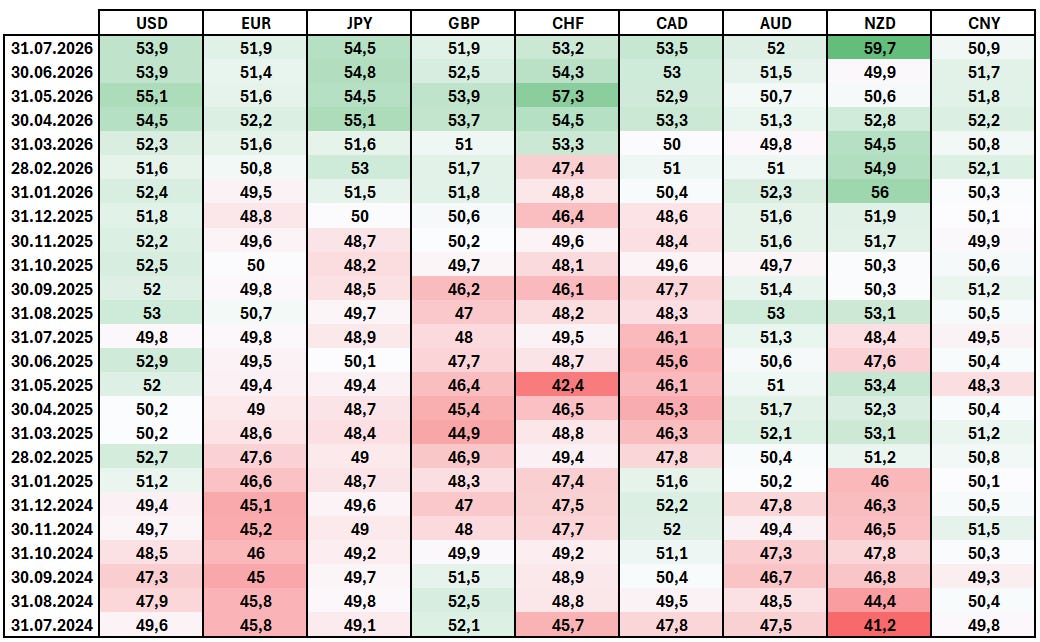
USD: Solid growth numbers. The latest Manufacturing PMI reading of 53.9 shows that growth is still strong in the US overall.
EUR: The tide seems to be turning for the EU overall. This is the sixth consecutive month with a positive PMI reading (PMI above 50), pointing to overall positive GDP growth.
JPY: Overall, these are strong PMI numbers, above 54 since March, which is impressive.
GBP: Same tentative growth trend in the UK as in the Eurozone. The latest figure of 51.9 shows positive but small GDP growth.
CHF: An interesting divergence between the cyclical GDP and the PMI figures. PMI readings have been strong since March, clearly above 50, while cyclical GDP points to lower growth. This divergence is typical at an inflection point in the cycle, because PMIs are strong leading indicators while cyclical GDP is more coincident, meaning it lags PMI by a few months.
CAD: A recent uptick shows healthy PMI numbers. Not quite convinced of an overall positive growth trend just yet, but solid Q2 FY2026 figures.
AUD: Continued positive PMI readings, with no clear sign of a slowdown.
NZD: The latest reading of 59.7 is a sharp jump from the 49.9 printed in June. Overall, a healthy growth trend since the start of mid-2025.
Key Takeaways
Growth Expectations: While PMIs report a growth trend for all economies within the coverage, cyclical GDP shows negative growth for the Eurozone, the UK, and Switzerland, while the rest of the coverage remains in upward momentum.
Because cyclical GDP lags PMIs by about two to three months, my suspicion is that we are at an inflection point for the broader Eurozone, and that in the months ahead we will see positive GDP growth here.
Looking at the Labor Market
Labour market indicators are, at best, coincident and often lagging. As such, they are not a primary driver in this framework. That said, they remain highly relevant from a policy perspective, given the weight central banks place on employment conditions when calibrating monetary settings.
Forecasting the Unemployment Rate
To forecast the unemployment rate, we look at the Ratio of Labor Costs to Corporate Profits. This metric is a powerful lead for corporate behavior; when margins compress, labor (the largest adjustable cost) is usually the first to be “optimized.”
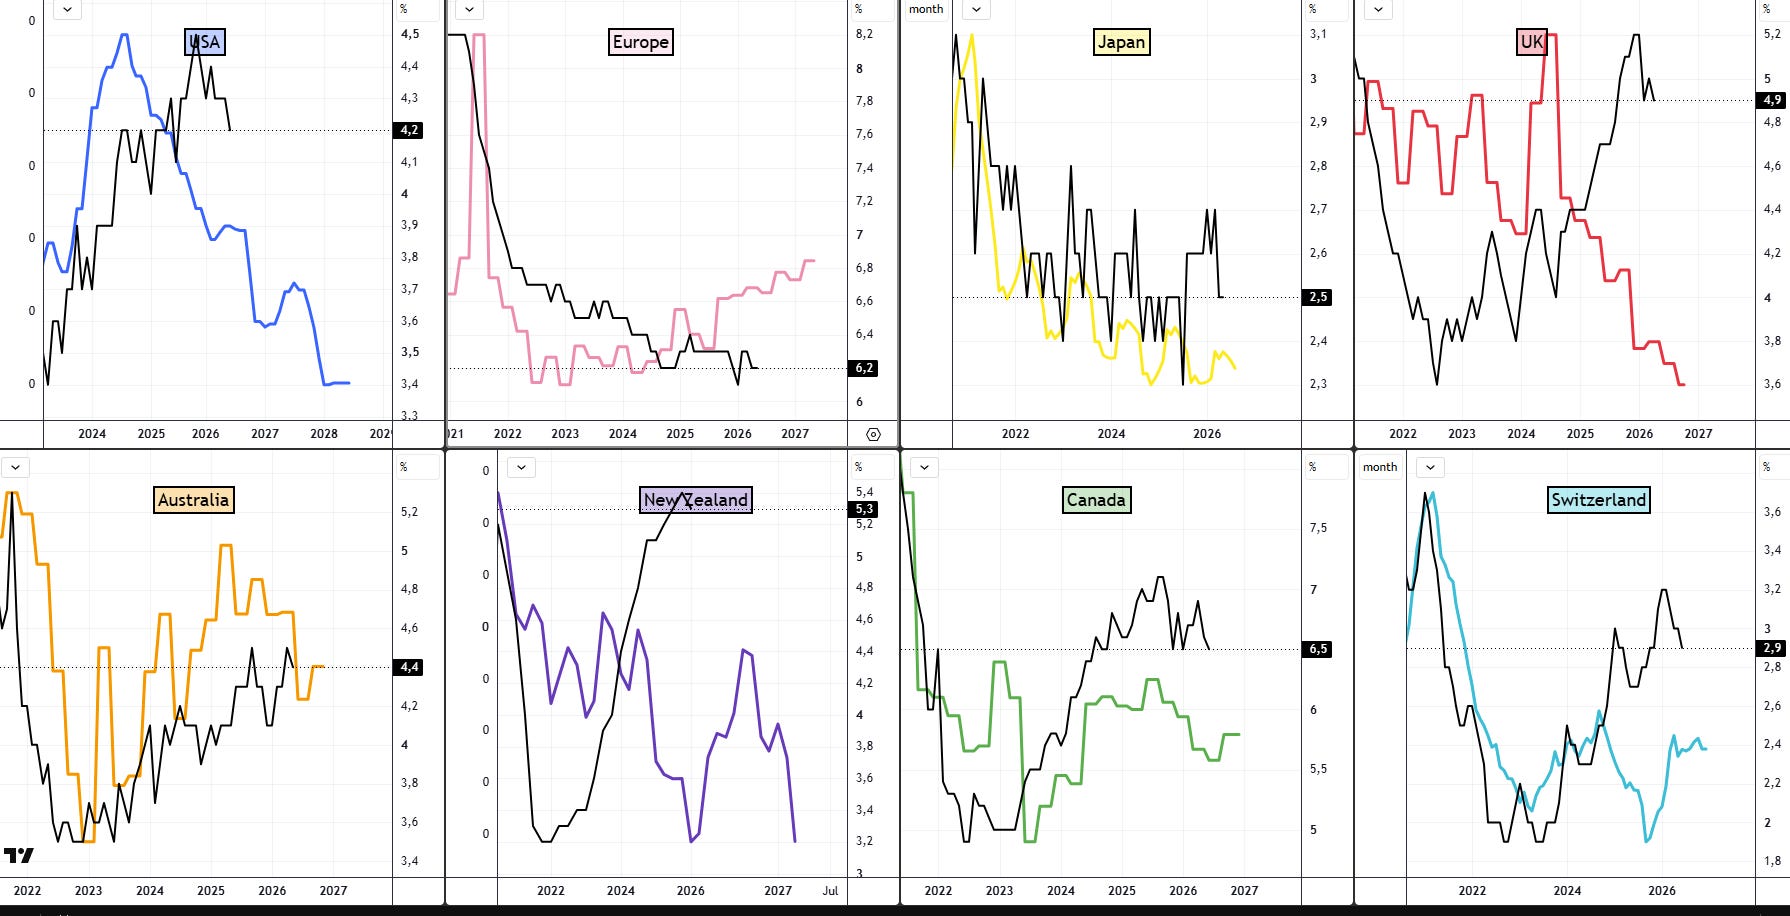
The proxies for the unemployment rate continue to point toward a stable job market, with a steady weakening in the European labor market as an exception.
Mapping Central Banks Policy
As outlined in the framework, central banks remain the most informed macro forecasters for their respective economies. They combine privileged data access with country-specific econometric models that are far more granular than any top-down alternative. Ignoring their projections when forming a policy view is therefore suboptimal. While central bank forecasts are not infallible, they provide a critical anchor for interpreting incoming data and market reactions.
Central Bank Projections
Not much has changed since the July edition; only the BoC and the BoE delivered new projections. Overall, the picture remains the same across the board: lower growth and higher inflation, is the expectations norm of central banks within the coverage.
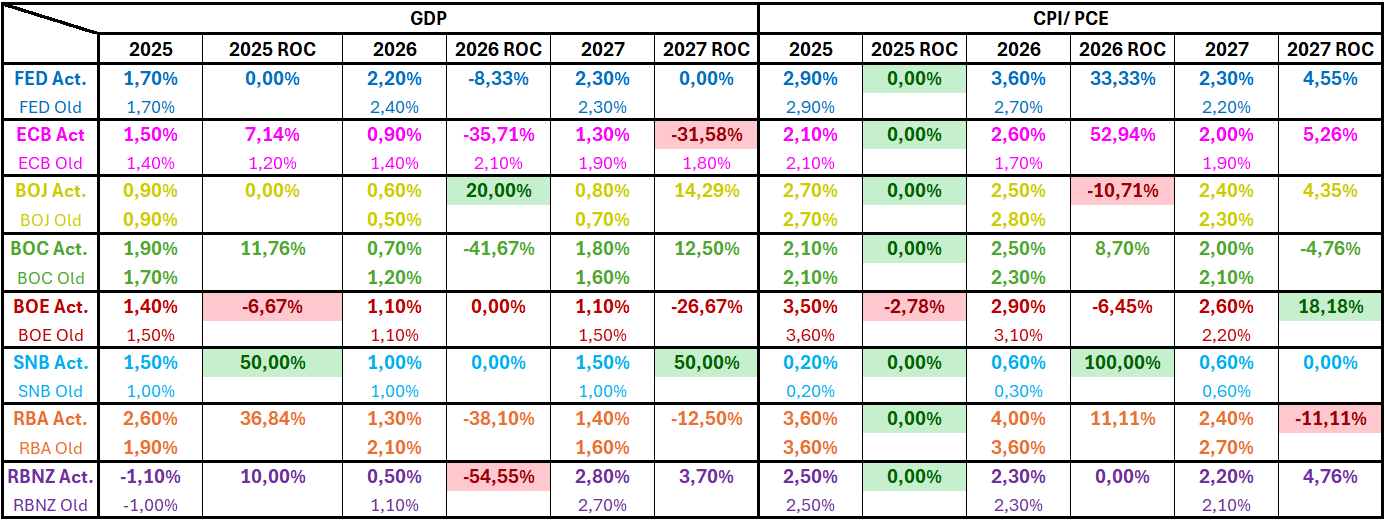
Lagging Indicators lead the key interest rate
To anticipate where central banks might steer rates, we look at the following:
The Model Signal (Brown): The inverse relationship between the unemployment rate and inflation.
The Market Signal (Colored): The 2s10s yield curve spread.
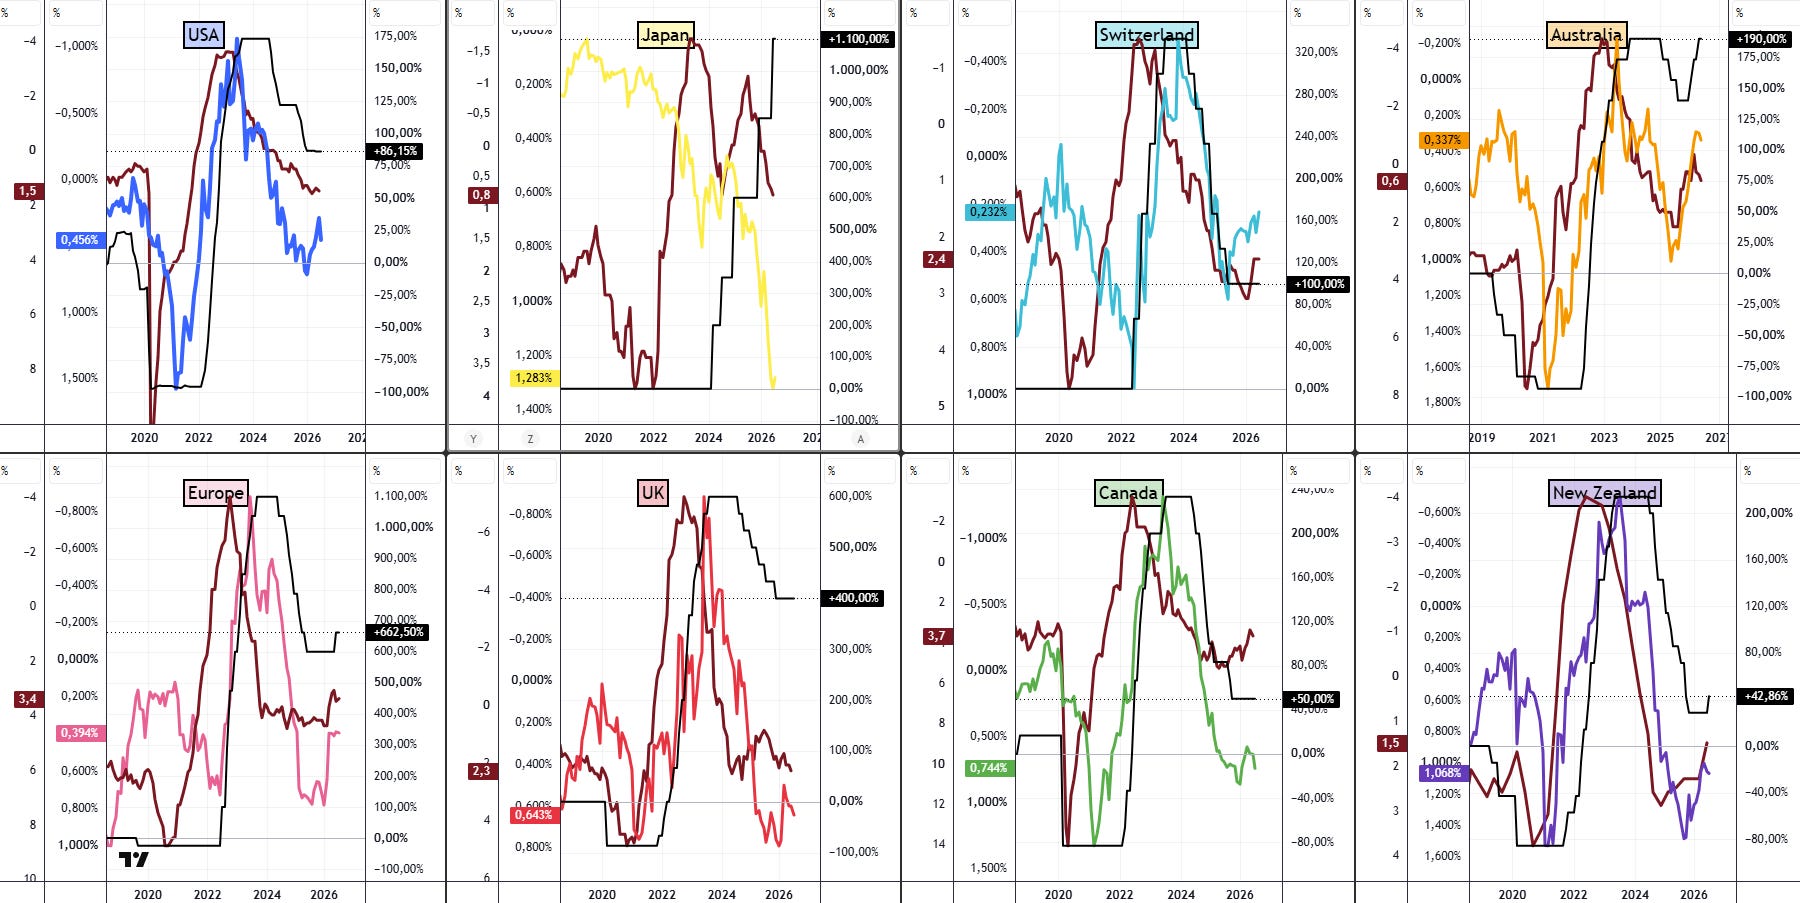
Overall, there is broad alignment between the yield curve and our model output, with the only notable exception being the US. Both argue for higher rates in Canada, New Zealand, and Switzerland, while also pointing to unchanged rates in the UK and Australia.
Combining Growth, Inflation and Central Banks
Condensing the data above into one chart, you would get something like this. Here we have a very dense visualization of the growth/inflation dynamics and central bank policy.
Bare in mind, this chart uses the rate of change of these measurments, not the prints itself.
Global Liquidity Conditions
This section explores systemic liquidity conditions and transmission channels. While still experimental, it provides useful context for understanding asset price behaviour and policy effectiveness.
Systemic Liquidity
Since 2021, we’ve lived in a QT regime. While the “normalization” narrative is popular, the reality is that the active tightening impulse has faded. We aren’t in a liquidity crunch yet, but the “Easy Money” tide has clearly receded.
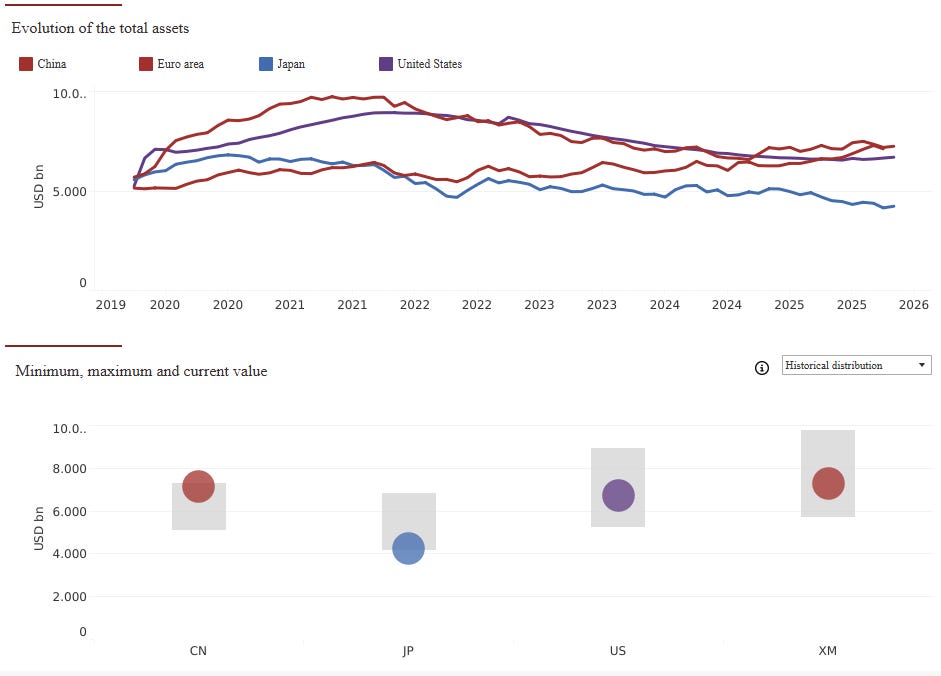
Net Liquidity
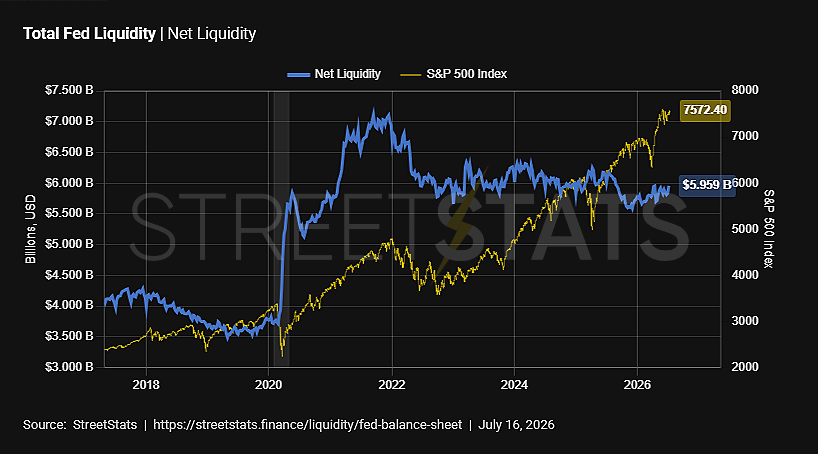
Overall Net Liquidity is down from its cycle peak in 2022 of around $7.05tn to around $5.95tn, or roughly 15% lower.
Credit Creation and Transmission
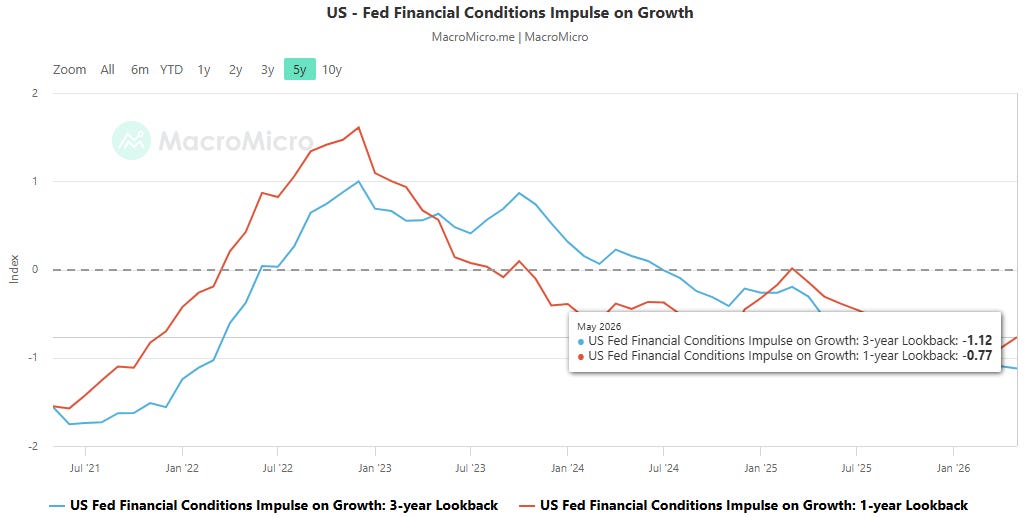
The Fed’s FCI-G impulse index — which measures financial conditions’ estimated drag or boost to GDP growth over the next 12 months — currently sits at -1.12 (3-year lookback) and -0.77 (1-year lookback), both firmly in tailwind territory after the 2022-23 tightening cycle’s headwind peaked near +1.5. Notably, the 3-year measure is now more negative than the 1-year, a reversal of the typical lead-lag pattern that suggests the pace of easing-driven support may already be past its peak. Read together, financial conditions remain net supportive of growth, but the impulse itself looks to be decelerating.
Final Output
To translate this mountain of data into a coherent narrative, we map the G8 economies across two primary dimensions - Growth and Inflation - and then overlay Central Bank (CB) Reaction Functions. This allows us to identify regime shifts and cross-country relative value (RV) opportunities.
Disclaimer
This publication is for informational and entertainment purposes only and does not constitute investment, financial, legal, or tax advice. Nothing contained herein should be considered a recommendation or solicitation to buy or sell any securities, currencies, commodities, derivatives, or other financial instruments.
All views expressed are solely those of the author at the time of writing and are subject to change without notice. While information is believed to be reliable, no representation or warranty is made regarding its accuracy or completeness.
Trading and investing involve substantial risk, and past performance does not guarantee future results. Readers are solely responsible for their own investment decisions.
The author may hold long or short positions in instruments mentioned and may change these positions at any time without notice.
By reading this publication, you agree that the author and publisher are not liable for any financial losses or decisions made based on the information provided.
